ProxySQL for PostgreSQL — Surviving an unplanned primary failure
Part of the ProxySQL for PostgreSQL — the failover model series. If you haven’t read the primer, the topology and hostgroup vocabulary below assumes it.
The problem
It’s 02:14. The pager fires: pg-prod-01 has stopped answering on port 5432.
The host did not reboot cleanly, the kernel did not panic — it just went dark
mid-transaction. Whatever was in flight to the primary at 02:14:00 is gone.
Whatever was already committed and replicated to a replica is safe. What the
application sees in the next few seconds is a short error burst, a reconnect,
and a stall; how long that stall lasts is the only number that matters at
02:14.
ProxySQL cannot prevent this kind of failure. It does not own the data, it does not write WAL, it cannot resurrect a primary whose disk is now an unrecoverable lump. It cannot conjure committed transactions that were sent to the primary but never made it to a replica — those are simply lost, and the only defense against that loss is synchronous replication, which is a choice you make at the PostgreSQL layer, not at the proxy layer.
What ProxySQL can shrink is a different number: the gap between the moment your HA tool finishes promoting a replica and the moment the application sees a successful write again. In the bare-PostgreSQL case, every connection in every application’s pool has to discover that the old primary is gone, fail, time out, reconnect to the new primary, re-establish session state, and try again. With ProxySQL in the path, the application keeps talking to the proxy at a stable address; only the proxy has to learn about the promotion, and that learning is configuration, not connection churn.
This post is about measuring exactly that. We build a 1-primary + 2-replica
sandbox, route an OLTP workload through ProxySQL, kill the primary’s
postmaster with SIGKILL, promote a replica, and answer three questions:
- How many errors does the application see at kill time?
- How long do writes stall before the application succeeds again?
- Does the application’s own connection to ProxySQL survive the event?
The answers, unsurprisingly, depend on choices ProxySQL doesn’t make — the HA tool’s detection latency, the promotion latency itself — but they also depend on choices ProxySQL does make, and we’ll separate the two.
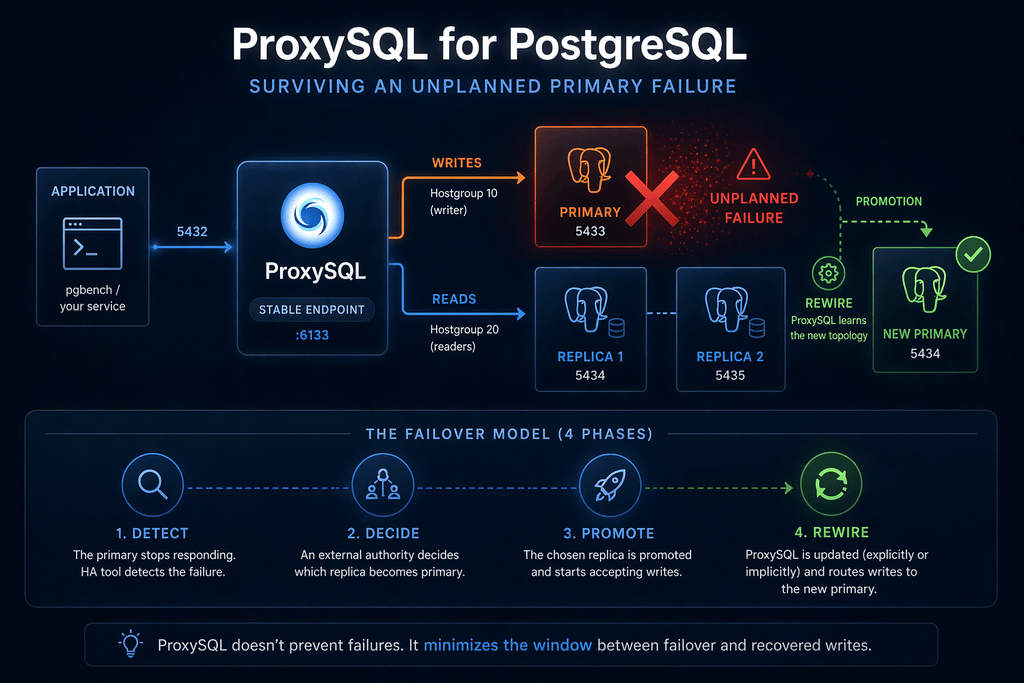
The failover model
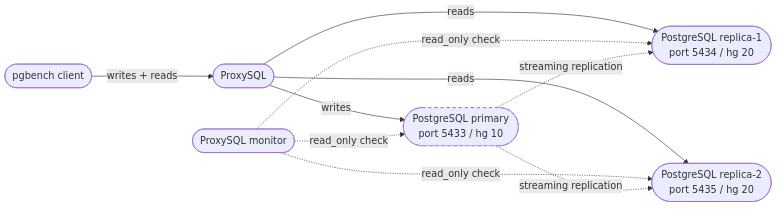
The topology is the canonical writer/reader split from the primer: one primary on port 5433 in writer hostgroup 10, two replicas on ports 5434 and 5435 in reader hostgroup 20. The application talks only to ProxySQL on port 6133. ProxySQL routes writes to whichever server is currently in hostgroup 10 and reads to whichever servers are in hostgroup 20. Replication between PostgreSQL instances is plain streaming replication; it is invisible to ProxySQL and ProxySQL has no opinion about it.
When the primary disappears, four things have to happen, in order, before the application is writing again:
-
Detect. Something has to notice that 5433 is dead. In a production stack this is the job of an external HA tool (Patroni, pg_auto_failover, Orchestrator — now maintained by the ProxySQL team and ported to PostgreSQL — RDS / Aurora’s control plane, etcd-based custodians). ProxySQL’s monitor does run a
pg_is_in_recovery()probe against every backend on a configurable interval, and a backend that fails the probe will get markedSHUNNEDand thenOFFLINE_HARD— but ProxySQL’s monitor does not by itself constitute an HA decision. It can make ProxySQL stop sending traffic to a dead host; it cannot pick a new primary. -
Decide. Some authority — the HA tool, an operator, a control plane — declares which replica becomes the new primary. This is not ProxySQL’s decision. ProxySQL has no quorum, no fencing, no view of replication lag versus a global LSN; it does not know which replica is most caught up and it does not pretend to. If you wire it to make this decision you will eventually wedge yourself into a split-brain.
-
Promote. The chosen replica is told to stop being a replica and start accepting writes. In our lab this is
pg_ctl promoteagainst replica-1; in Patroni this is a controlled switchover; in RDS it’s a Multi-AZ failover orchestrated by AWS. We will make another blog post with Orchestrator, the HA solution that we maintain and that is deeply integrated with ProxySQL. The promotion itself takes some number of milliseconds to seconds depending on the engine and the amount of WAL to replay, and ProxySQL does not influence it. -
Rewire. Now ProxySQL must learn that the writer for hostgroup 10 is no longer port 5433 but 5434. There are two ways this happens.
- The explicit way — what
promote.shdoes in our lab — is to issue admin SQL directly:DELETE FROM pgsql_servers WHERE port=5433,UPDATE pgsql_servers SET hostgroup_id=10 WHERE port=5434,LOAD PGSQL SERVERS TO RUNTIME. - The implicit way, configured via
pgsql_replication_hostgroupswithcheck_type='read_only', lets ProxySQL’s monitor flip the assignment automatically the next time it sees that 5434’spg_is_in_recovery()returnedfalseand 5433’s returnedtrue(or errored).
The implicit path is more robust under complicated topologies; the explicit path lets you measure the upper bound of failover latency without depending on monitor cadence, which is why the lab uses it.
- The explicit way — what
What changes for the application across this whole sequence? Its connection
endpoint — proxysql:6133 — does not change at all. There is no DNS
update, no client-library reconnect logic to a new hostname, no service
discovery refresh. The proxy keeps the address; the proxy’s pool of
backend connections is what gets redrawn underneath, and so do the
application’s own connections that happened to be mid-query when the
primary died.
The lab
The lab is a single-host sandbox: three PostgreSQL instances and one
ProxySQL instance, all bound to 127.0.0.1 on different ports. Nothing
talks over a real network, no disks compete for the same IO queue except
where the kernel says they do, and there is no operating cost to the
“failover” beyond what pg_ctl promote already does. This is the cleanest
floor for failover latency you can measure; production numbers will be
larger by whatever your real environment adds (network round trips, EBS
volume mounts, control-plane latencies, application pool warmup). The
fairness note at the end of next paragraph says this again, in stronger words.
The multi-instance-on-one-host pattern is the same shape dbdeployer gives you for MySQL. dbdeployer is now maintained by the ProxySQL team, and we are extending it to cover PostgreSQL as a first-class target; a future post in this series will walk through setting up PostgreSQL sandboxes with dbdeployer directly. The scripts in this lab do the same work by hand while that work is in progress.
| Component | Port | Role | Hostgroup |
|---|---|---|---|
| primary | 5433 | PostgreSQL primary | 10 |
| replica-1 | 5434 | streaming replica | 20 → 10* |
| replica-2 | 5435 | streaming replica | 20 |
| ProxySQL | 6133 | application endpoint | — |
| ProxySQL | 6132 | admin SQL (PG wire) | — |
*replica-1 is moved into hg 10 by promote.sh after the kill.
Full scripts in labs/02-unplanned/. The
relevant pieces are bring-up.sh (initdb the primary, pg_basebackup
two replicas, start ProxySQL, register backends), inject.sh (the
SIGKILL), promote.sh (the pg_ctl promote plus the admin-SQL rewrite),
and tear-down.sh (destroy everything). The benchmark harness lives one
directory up at labs/benchmark/ and is shared by every post in this
series.
A successful bring-up looks like this:
$ ./bring-up.sh
waiting for server to start.... done
server started
CREATE ROLE
CREATE ROLE
CREATE ROLE
CREATE DATABASE
waiting for server to start.... done
server started        # replica-1
waiting for server to start.... done
server started        # replica-2
... ProxySQL startup banner ...
bring-up complete (1P + 2R + ProxySQL).
ProxySQL’s admin interface listens on two ports that expose the same
SQL surface: 6132 for the MySQL wire protocol and 6134 for the
PostgreSQL wire protocol. A PostgreSQL lab naturally talks to 6134
with plain psql. The SQL is ProxySQL’s own (pgsql_servers,
pgsql_users, LOAD PGSQL SERVERS TO RUNTIME, …); the wire protocol
is just whichever one your client speaks.
The ProxySQL configuration is a flat handful of admin-SQL inserts; the
bring-up runs them via psql -h 127.0.0.1 -p 6134 -U admin:
INSERT INTO pgsql_servers (hostgroup_id, hostname, port) VALUES (10, '127.0.0.1', 5433);
INSERT INTO pgsql_servers (hostgroup_id, hostname, port) VALUES (20, '127.0.0.1', 5434);
INSERT INTO pgsql_servers (hostgroup_id, hostname, port) VALUES (20, '127.0.0.1', 5435);
INSERT INTO pgsql_users (username, password, default_hostgroup) VALUES ('app', 'app', 10);
INSERT INTO pgsql_replication_hostgroups (writer_hostgroup, reader_hostgroup, check_type)
    VALUES (10, 20, 'read_only');
LOAD PGSQL SERVERS TO RUNTIME;
The pgsql_replication_hostgroups row is the implicit-rewire path
mentioned in a paragraph above: it tells ProxySQL’s monitor “the server in hg 20 whose
pg_is_in_recovery() returns false belongs in hg 10”. The lab keeps it
configured but also rewrites pgsql_servers explicitly during promotion,
so the measured failover window does not depend on the monitor’s poll
interval.
A note on the workload driver
The driver that generates the OLTP load matters for this specific
measurement, because what we’re measuring is how an application behaves
when a backend vanishes mid-query. pgbench — the obvious choice — is a
poor fit here: when its backend connection breaks, pgbench aborts the
affected client for the rest of the run (--max-tries only covers
serialization and deadlock errors, not connection loss). Every production
app pool we know of reconnects on a dropped connection and retries the
transaction; pgbench doesn’t, so using it would measure “pgbench does
not reconnect” instead of “how ProxySQL handles the failover.”
The lab therefore uses a small Python driver,
driver_py.py, that does exactly what
a production pool does: each worker keeps one connection to ProxySQL,
runs the pgbench_accounts UPDATE workload in an explicit BEGIN … COMMIT block, and on any error closes the connection, reconnects, and
resumes. Eight workers, 90-second trial, SIGKILL at the 30-second mark.
The per-transaction log it writes is pgbench--l-compatible so the rest
of the harness (bucketing, charts, summary stats) is unchanged.
Triggering the failure
The kill itself is a single line — inject.sh reads the primary’s
postmaster.pid and sends SIGKILL:
PID=$(head -n 1 "$BASE/primary/postmaster.pid")
kill -9 "$PID"
SIGKILL is uncatchable; the postmaster cannot run a shutdown handler,
cannot flush WAL it has not yet flushed, cannot write a clean shutdown
record. From PostgreSQL’s point of view this is indistinguishable from a
host-level loss of power. From ProxySQL’s point of view, the next
transaction sent to 5433 will fail at the TCP layer.
Promotion runs from promote.sh, kicked off by the harness one second
after the kill via the inject chain inject.sh && sleep 1 && promote.sh:
pg_ctl -D "$BASE/replica-1" promote
PGPASSWORD=admin psql -h 127.0.0.1 -p 6134 -U admin -v ON_ERROR_STOP=1 <<'SQL'
    DELETE FROM pgsql_servers WHERE hostname='127.0.0.1' AND port=5433;
    UPDATE pgsql_servers SET hostgroup_id=10 WHERE hostname='127.0.0.1' AND port=5434;
    LOAD PGSQL SERVERS TO RUNTIME;
SQL
The 1-second pause separates the two halves of the failover window: before the pause, only ProxySQL’s own connection-error handling and backend probing are at work; after the pause, the new primary is accepting writes and the only thing standing between the application and recovery is whether ProxySQL has been told about the new topology. We use this gap in the next paragraph to attribute the measured latency to the right component.
What we measured
Three trials, ninety-second run each, SIGKILL injected at the thirty-second
mark, recovery measured at 100-millisecond resolution. Headline numbers,
from labs/02-unplanned/OBSERVED.md:
| metric | median | min | max |
|---|---|---|---|
writes_resume_ms | 1600 ms | 1600 ms | 1800 ms |
error_count_post_inject | 8 | 8 | 8 |
total_ok_pre_inject | 565342 | 565209 | 571463 |
writes_resume_ms is how long after the SIGKILL successful writes
appear again — specifically, the time from the kill to the first
100 ms bucket with ok>0 and err==0 following any bucket with
ok==0 or err>0. Median 1600 ms, range 1600–1800 ms, from the
kill of the primary postmaster to the first clean bucket of successful
writes through ProxySQL.
The error_count_post_inject is literal: exactly eight errors per
trial, one per worker. Eight workers, eight concurrent in-flight
transactions at the kill instant, eight connection-level errors surfaced
to the application. Every one of those errors was followed by a
successful reconnect on the same worker’s logical connection to ProxySQL
— the workers did not die, they just saw one transaction fail, reopened
the backend path, and resumed.
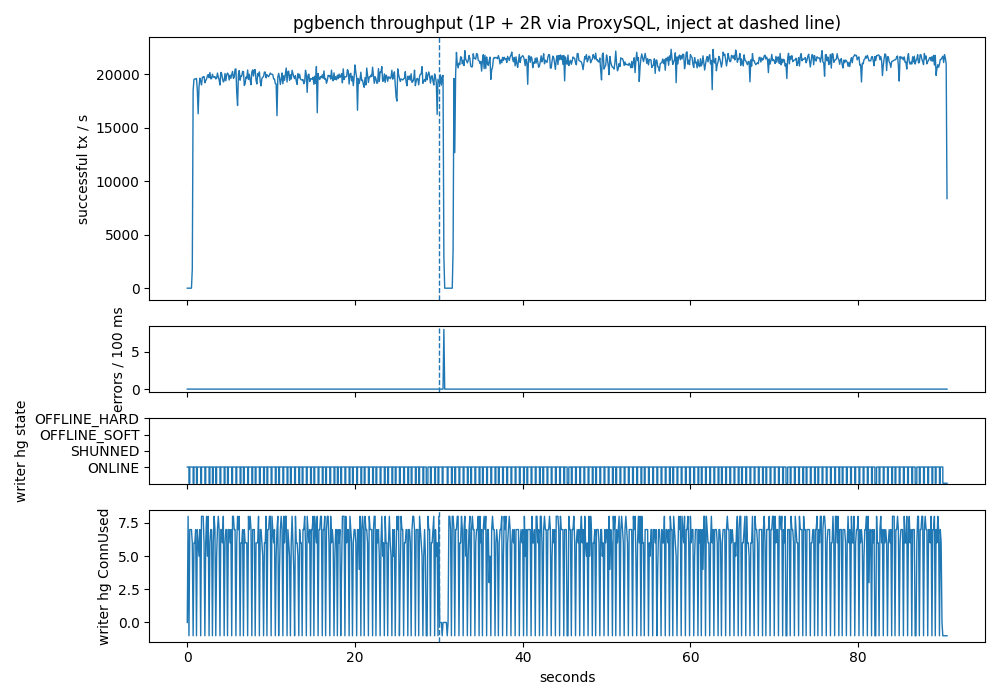
The chart, from the median trial, has four panels.
The top panel is throughput in successful transactions per second, bucketed at 100 ms. For the first thirty seconds it sits in a noisy band around 19 000–20 000 tps — the application’s baseline. The dashed vertical line marks the inject. Throughput drops to zero four to five buckets later and stays there for roughly eleven consecutive 100 ms buckets; at t = 31.6 s writes resume and the rate climbs back to baseline within two more buckets.
The middle panel is errors per 100 ms. It is a flat line at zero across all ninety seconds except for a single narrow burst totalling eight errors around t = 30.4–30.5 s — the eight in-flight transactions that were mid-UPDATE when the postmaster died. This is the application-visible cost of the failover.
The third panel is the writer hostgroup’s backend state as ProxySQL’s
admin reports it. It is essentially flat at ONLINE across the entire
window (the alternating -1 samples are momentary admin-probe-connection
errors; they do not reflect real backend state). This is not because
ProxySQL refused to notice the dead primary — it is because promote.sh
deletes the dead row from pgsql_servers and re-tags the new primary in
a single LOAD PGSQL SERVERS TO RUNTIME, faster than the 100-millisecond
admin probe the harness samples at. The writer hostgroup goes from
“5433 ONLINE” to “5434 ONLINE” with no SHUNNED or OFFLINE_HARD
transition visible to a 10-Hz observer.
The bottom panel is ConnUsed on the writer hostgroup — how many
pooled backend connections are currently in flight. It hugs the 5–8 band
during normal operation, collapses to zero during the 1.1 s outage
(there is no writer to hold a connection to), and climbs back to the
same band as soon as the new primary is registered and clients resume.
Fairness note. Single-host dbdeployer-style lab. No real network, no disk contention, no cloud failover latency. These numbers are relative comparisons only — do not use them as production forecasts.
Reading the numbers
The 1600 ms median window is not a single thing. It is a short sequence
of effects in series, and a full second of it is a hard-coded delay
in the lab that has nothing to do with ProxySQL or PostgreSQL:
- Error surfacing (~400–500 ms). The in-flight transactions on
the eight workers’ backend connections do not fail immediately when
the postmaster dies. PostgreSQL backends are child processes of
the postmaster; they continue serving the query they are in the
middle of and only shortly after notice (via the postmaster death
pipe) that their parent is gone. During this window pgbench-style commits
keep succeeding on the old backends — it is not application-visible
downtime. The exact value is a PostgreSQL tunable, not a ProxySQL
choice. - Inject-chain sleep (1000 ms, artificial). The harness injects
failure withinject.sh && sleep 1 && promote.sh. That 1-second
sleep is a stand-in for an HA tool’s detection / probing
interval — the time a real Patroni, pg_auto_failover, Orchestrator,
or RDS control plane spends deciding “the primary is really gone,
let’s promote.” It is the dominant term in this lab number and it
is entirely under the HA tool’s control; Post 5 and Post 6 measure
it against real HA tools. - Promotion + rewire (~100 ms).
pg_ctl promotefinishes the recovery handoff on replica-1, andpromote.shthen runs its admin SQL against ProxySQL. On this machine the two together complete in roughly 100 ms. - First successful reconnect (~100 ms). Once the writer hostgroup
has been rewritten, the next retry from each worker opens a new
backend connection to 5434 through ProxySQL and its
BEGIN / UPDATE / COMMITblock succeeds on the first try. That’s why throughput snaps back instead of ramping.
Subtract the artificial 1-second sleep and what remains — promotion,
rewire, and reconnect — is well under 200 ms. In other words:
once a failure has been detected, ProxySQL plus pg_ctl promote can
complete the entire failover in a fraction of a second. The 1600 ms
headline is what you would see with an HA tool that happens to take
exactly one second to detect the failure; with a faster detector the
end-to-end window shrinks to whatever that detector takes plus ~200 ms.
The monitor interval — monitor_read_only_interval, defaulting to
1500 ms — does not appear in this breakdown because the lab rewires
explicitly via admin SQL. If you remove the explicit rewrite and rely on
pgsql_replication_hostgroups + check_type='read_only' alone, you
should expect the median to drift up by up to one monitor interval,
because ProxySQL has to observe the new topology before it can route
to it.
Takeaways
- Once the failure has been detected, ProxySQL completes the failover
in well under one second. The 1600 ms median the lab reports
includes a hard-coded 1-second
sleepthat stands in for the HA tool’s detection interval. Back that out and the ProxySQL-attributable work — promote the replica, rewire the writer hostgroup, reconnect the application workers — totals roughly 200 ms across all three trials. The end-to-end failover window your users experience is (your HA tool’s detect latency) + ~200 ms. - The application saw exactly eight errors — one per in-flight worker — and zero lost logical connections. With a reconnect-on-error retry loop (which is what every production app-pool implements), SIGKILL of the primary presents as a short error burst followed by a sub-second stall. Size app-side timeouts and retry budgets so this does not page anyone. If there were no in-flight transaction, the application wouldn’t have seen any error.
- ProxySQL did not promote anything. It noticed a dead backend,
rerouted the writer hostgroup as instructed by
promote.sh, and held a stable127.0.0.1:6133endpoint across the swap. Don’t configure it as if it picks primaries. - Tune
monitor_read_only_intervalto match your error budget. If you rely on the implicit-rewire path (pgsql_replication_hostgroups/check_type='read_only'), this interval is the upper bound on how long the writer hostgroup sits empty. Default 1500 ms is fine for minutes-class SLAs; lower to ≤ 1000 ms otherwise. - Run a driver that actually reconnects.
pgbenchaborts on connection loss and will mislead you into reporting a much worse failover story than a real application experiences. The lab’sdriver_py.pyis eighty lines of Python and is the right kind of thing to benchmark failover against.
ProxySQL is GPL, actively developed, and now gives PostgreSQL
operators the same proxy-side failover story MySQL operators have
relied on for years. Whether you run Patroni, pg_auto_failover,
Orchestrator, RDS, Aurora,
or a hand-rolled pg_ctl promote script, putting ProxySQL in front
turns a primary loss into a short error burst plus a sub-second stall
on a stable endpoint. Point your next PostgreSQL deployment at
proxysql:6133 and see the difference on your own traffic.