Part 3 - PgBouncer to ProxySQL: Simple-Mode Benchmark
Part 1: Rethinking the PostgreSQL Middle Tier made the architectural case for putting more responsibility in the proxy layer. Part 2: A Brief Feature Comparison walked through what PgBouncer and ProxySQL each actually do, feature by feature. This post is the smaller, narrower follow-up to both: what does the choice cost you in raw throughput on a single representative workload? No architectural arguments, no feature matrix. Just numbers, from one machine, under conditions that are easy to reproduce.
The question we’re trying to answer is concrete: once you’ve decided to put a pooler in front of PostgreSQL, what does the pooler itself cost you, and which pooler costs least?
The short answer for pgbench simple mode under SSL: ProxySQL with four worker threads delivers ~77 K TPS at c=100 — roughly 2.3× the throughput of PgBouncer at the same load. Throughput scales with worker threads (two workers reach ~46 K TPS, four reach ~77 K), and the throughput lead holds at every concurrency point from c=50 upward.
The rest of this post is about whether that pattern holds across concurrency levels, and what the data is and isn’t claiming.
Setup
Everything in this section is verbatim from the benchmark run — every value is what the live configuration actually used. Copy, adapt, and reproduce.
Hardware
| CPU | AMD Ryzen 9 5950X — 16 physical cores / 32 threads |
| RAM | 125 GiB |
| OS | Ubuntu 24.04 LTS, Linux kernel 6.17 |
| CPU governor | performance (all cores) |
Everything — PostgreSQL, both poolers, and the pgbench client — runs on the same box, so the network path is unix-loopback class and the per-request cost we’re measuring is genuinely the proxy’s own work, not transit time.
Software versions
| Component | Version |
|---|---|
| PostgreSQL | 17 (Ubuntu pgdg, single instance on 127.0.0.1:5432) |
| PgBouncer | 1.25.1 (libevent 2.1.12, c-ares 1.27.0) |
| ProxySQL | pre-release of 3.0.9, built from the v3.0_partition-gate development branch |
pgbench | 17.9 |
| OpenSSL | 3.5.6 |
SSL is on for every connection — client → pooler, pooler → Postgres — using the same Benchmark CA-signed certificate material on both sides.
PostgreSQL backend
Data created with pgbench -i -s 100 (~10 M rows in pgbench_accounts), and autovacuum is disabled on the bench tables for stability. Postgres-side knobs that matter for these numbers:
shared_buffers   = 2GB
max_connections  = 2000
ssl              = on
pg_hba.conf needs an SSL-enforcing rule for the bench user (the poolers connect with sslmode = require):
hostssl benchdb bench_user 127.0.0.1/32 passwordPgBouncer configuration
The full pgbouncer.ini checked into the benchmark. pool_mode = transaction and default_pool_size = 50 are the two settings that load-bear; the rest are either standard or set conservatively so they don’t interfere with the measurement window.
[databases]
benchdb = host=127.0.0.1 port=5432 dbname=benchdb

[pgbouncer]
listen_addr        = 127.0.0.1
listen_port        = 6432
pool_mode          = transaction
default_pool_size  = 50
max_client_conn    = 1000
reserve_pool_size  = 0
min_pool_size      = 0

auth_type          = plain
auth_file          = /etc/pgbouncer/userlist.txt

# TLS on both sides
client_tls_sslmode    = require
client_tls_cert_file  = /etc/ssl/server.crt
client_tls_key_file   = /etc/ssl/server.key
client_tls_ca_file    = /etc/ssl/ca.crt
server_tls_sslmode    = require
server_tls_cert_file  = /etc/ssl/client.crt
server_tls_key_file   = /etc/ssl/client.key
server_tls_ca_file    = /etc/ssl/ca.crt

# Defaults that don't matter for this run but you'll want explicit
server_check_query = SELECT 1
max_prepared_statements = 256
ProxySQL configuration
The full proxysql.cnf. pgsql-threads is the only thing that varies between runs (1, 2, or 4 → labelled t1 / t2 / t4 in the charts). The per-server max_connections = 50 matches PgBouncer’s default_pool_size = 50, so both poolers hit Postgres with the same 50-connection back-pressure budget.
pgsql_variables =
{
    pgsql-interfaces            = "127.0.0.1:6433"
    pgsql-threads               = 4              # vary: 1, 2, or 4
    pgsql-max_connections       = 1000
    pgsql-multiplexing          = true
    pgsql-have_ssl              = true
    pgsql-authentication_method = 1              # plain
}

pgsql_servers =
(
    {
        address         = "127.0.0.1"
        port            = 5432
        hostgroup       = 1
        status          = "ONLINE"
        weight          = 1
        max_connections = 50                     # = pgbouncer's default_pool_size
        use_ssl         = 1
    }
)

pgsql_users =
(
    {
        username           = "bench_user"
        default_hostgroup  = 1
        active             = 1
        use_ssl            = 1
    }
)
pgsql-threads is not capped at 4 — the upper bound is the number of CPU cores you’re willing to give the proxy. We stopped the matrix at four to keep the chart legible; the same scaling pattern continues upward until either the backend pool or the CPU runs out.
Workload
A custom pgbench script (custom_select_4kb.sql) — a parameterless SELECT returning ~42 rows of pgbench-shaped data (≈4 KB on the wire per call). The transaction is small enough that the proxy’s per-request CPU cost dominates wall-clock time, which is exactly the regime where pooler differences are visible. Workloads that spend more time on the backend (heavy joins, large result sets, writes) shift the bottleneck away from the proxy and compress every proxy’s number toward the backend’s.
Per-cell invocation:
# Warmup (pooler targets only): 20 s, results discarded
PGSSLMODE=require pgbench \
    -h 127.0.0.1 -p <pooler_port> -U bench_user -d benchdb \
    -c <clients> -j $(( clients < 16 ? clients : 16 )) \
    -T 20 --protocol=simple -f custom_select_4kb.sql >/dev/null

# Measure: 60 s
PGSSLMODE=require pgbench \
    -h 127.0.0.1 -p <pooler_port> -U bench_user -d benchdb \
    -c <clients> -j $(( clients < 16 ? clients : 16 )) \
    -T 60 --protocol=simple -f custom_select_4kb.sql
Where <pooler_port> is 5432 (direct), 6432 (PgBouncer), or 6433 (ProxySQL), and <clients> cycles through the matrix.
Benchmark matrix
| Targets | direct, pgbouncer, proxysql (t1 / t2 / t4) |
| Concurrent clients | 1, 50, 100, 500, 1000 |
| Mode | simple (pgbench --protocol=simple) |
| Iterations per cell | 3 |
| Between iterations | PostgreSQL restarted, fresh pooler process |
| Warmup | 20 s (pooler targets only) |
| Measurement window | 60 s |
pgbench -j | min(clients, 16) |
5 client counts × 3 iterations = 15 measurements per (target, threads), 75 per mode, 225 across the matrix in this post’s scope. Charts show iteration means with min/max error bars; the three samples in each cell agreed within ~1 %, which is why the error bars are usually barely visible.
On the comparison: the matrix runs one PgBouncer process vs one ProxySQL instance at every cell. PgBouncer’s standard scaling path is to run multiple processes per node behind SO_REUSEPORT or a load balancer, and ProxySQL can also be deployed as a fleet — but this benchmark holds both to a single instance so each pooler is measured against the workload rather than against operator tuning of process counts.
Summary
The summary below shows throughput at each load level, with PgBouncer as the baseline (1.00×). Each cell is absolute throughput — ratio to PgBouncer at the same load, averaged over 3 iterations.
| c=50 | c=100 | c=500 | c=1000 | |
|---|---|---|---|---|
| PgBouncer (baseline) | 34.0 K — 1.00× | 33.2 K — 1.00× | 29.7 K — 1.00× | 28.5 K — 1.00× |
| ProxySQL · 1 worker | 32.0 K — 0.94× | 32.6 K — 0.98× | 29.1 K — 0.98× | 27.9 K — 0.98× |
| ProxySQL · 2 workers | 47.7 K — 1.40× | 45.9 K — 1.38× | 40.3 K — 1.36× | 36.9 K — 1.29× |
| ProxySQL · 4 workers | 73.7 K — 2.17× | 76.7 K — 2.31× | 61.0 K — 2.05× | 49.2 K — 1.73× |
Two patterns to notice:
- ProxySQL · 1 worker holds at 0.94–0.98× of PgBouncer across the entire concurrency range. That ~2–6 % gap is the cost of everything ProxySQL does on every query — query rules, hostgroup routing, per-query digest stats, and more (see Part 2 for the full list). PgBouncer doesn’t do this query-aware work — it pools connections and forwards bytes without parsing the protocol. At the same CPU budget, ProxySQL keeps pace anyway.
- ProxySQL · 4 workers sits at 1.73× to 2.31× PgBouncer at every load point. This headroom matters when proxy CPU starts to be the bottleneck — high-concurrency, short-query workloads (typical OLTP reads, microservice fleets) where a single-thread proxy hits its dispatch ceiling and a multi-thread one keeps going.
Throughput across concurrency
This is the picture that answers “how do these pooler designs behave under load?” in one chart:
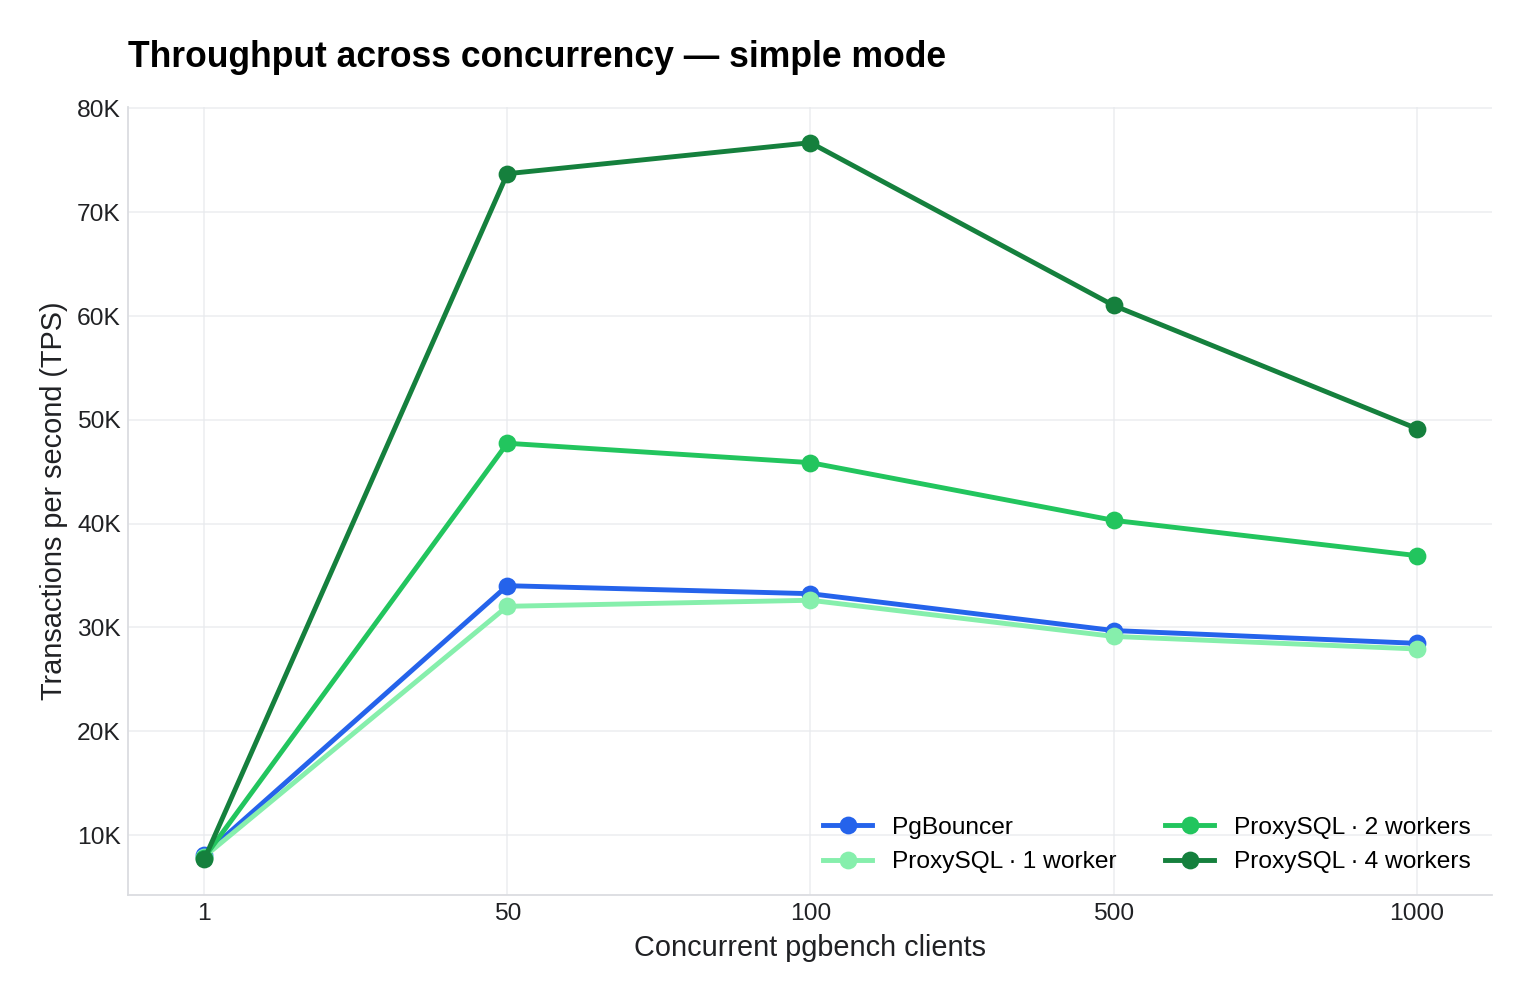
A few features are worth pointing out:
At c=1, the poolers cluster around 8 K TPS — pgbouncer and all three ProxySQL configurations within a few hundred TPS of each other. With a single client there’s no parallelism to exploit and the worker-thread knob has nothing to do; the choice of pooler barely registers at this load.
At c=50 and c=100 the curves separate. ProxySQL with two and four workers pulls ahead in proportion to thread count, opening a clear gap above the single-thread cluster of PgBouncer and ProxySQL · 1 worker. The shape of the divergence is exactly what the architecture predicts: more proxy worker threads, more requests forwarded per second.
At c=500 and c=1000 the backend pool of 50 connections is the bottleneck — there are 10× to 20× more clients than pool slots, so every query has to wait its turn in a queue before reaching the backend. The proxy is the one managing that queue. PgBouncer’s single thread does the queue-management work alone, holding throughput at ~28–30 K TPS. ProxySQL · 4 workers has four threads working the queue in parallel and keeps delivering 49–61 K TPS — same workload, but the queue moves faster. ProxySQL · 2 workers sits in between.
Zooming in at c=100
c=100 is a useful single point to dwell on: enough concurrency that the pooler is doing real work, not so much that backpressure dominates. With pool_size=50 and 100 clients, every pooler is by definition multiplexing — two client requests on average competing for each backend connection. This is the load region where the per-thread cost of the proxy matters most.
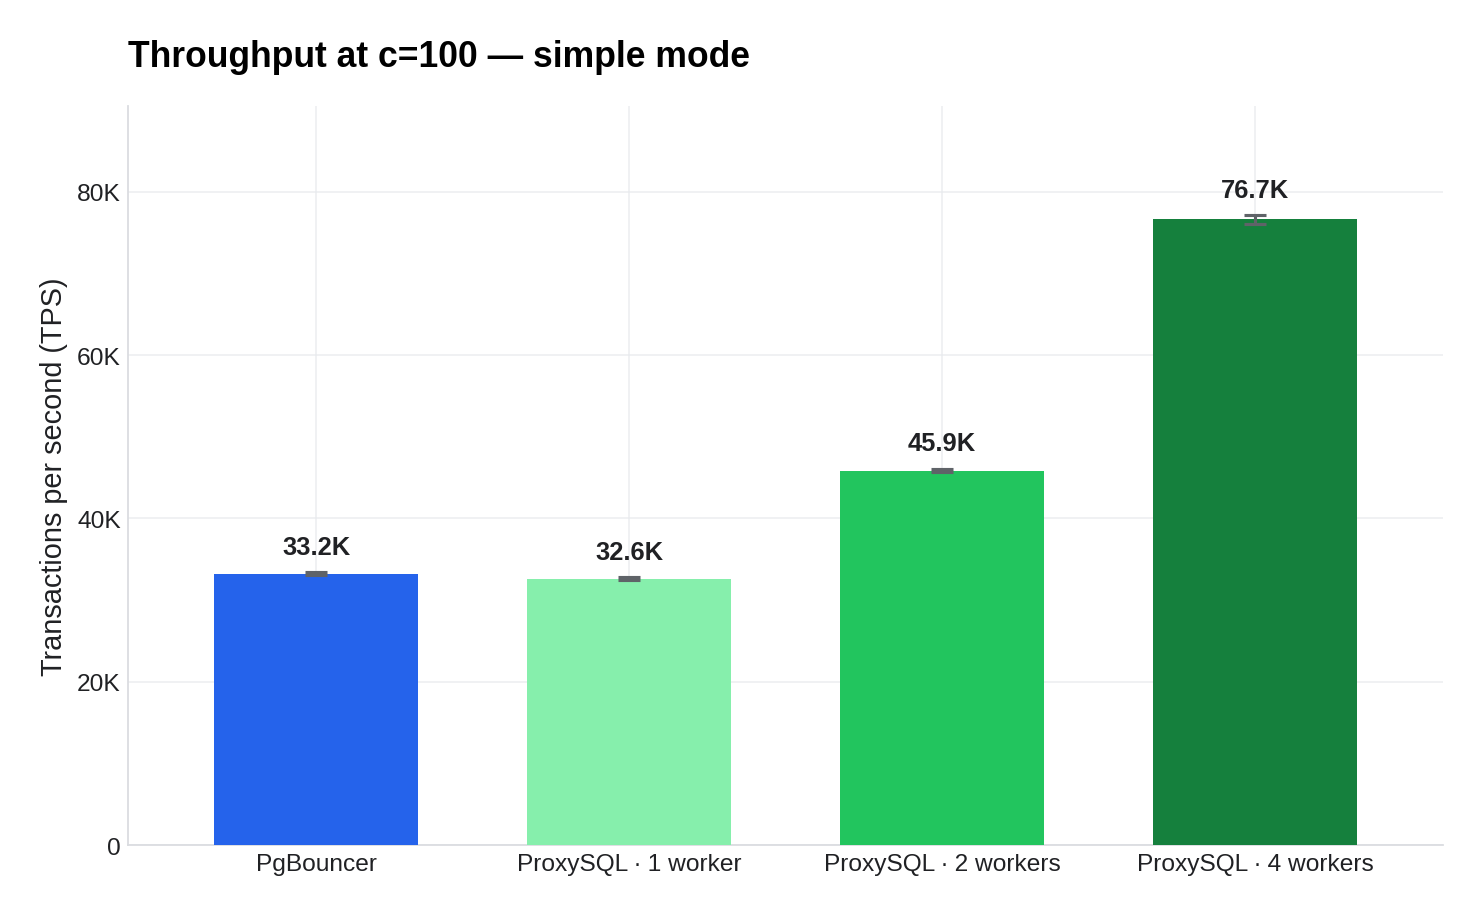
- PgBouncer lands at ~33.2 K TPS, almost exactly where its single thread is running flat out.
- ProxySQL with one worker lands at ~32.6 K TPS — the single-thread reference point (one ProxySQL worker == one core, included to make the per-worker scaling visible).
- ProxySQL with two workers moves to ~45.9 K TPS — a 1.4× lift for adding one more worker thread.
- ProxySQL with four workers reaches ~76.7 K TPS — 2.3× PgBouncer.
Zooming in at c=1000
c=100 with pool_size = 50 is only 2× oversubscription — both poolers are barely working. c=1000 with pool_size = 50 is 20× oversubscription, where the backend connection pool is fully saturated and the proxy’s queue management quality is the dominant factor. This is where multiplexing actually has to do something.
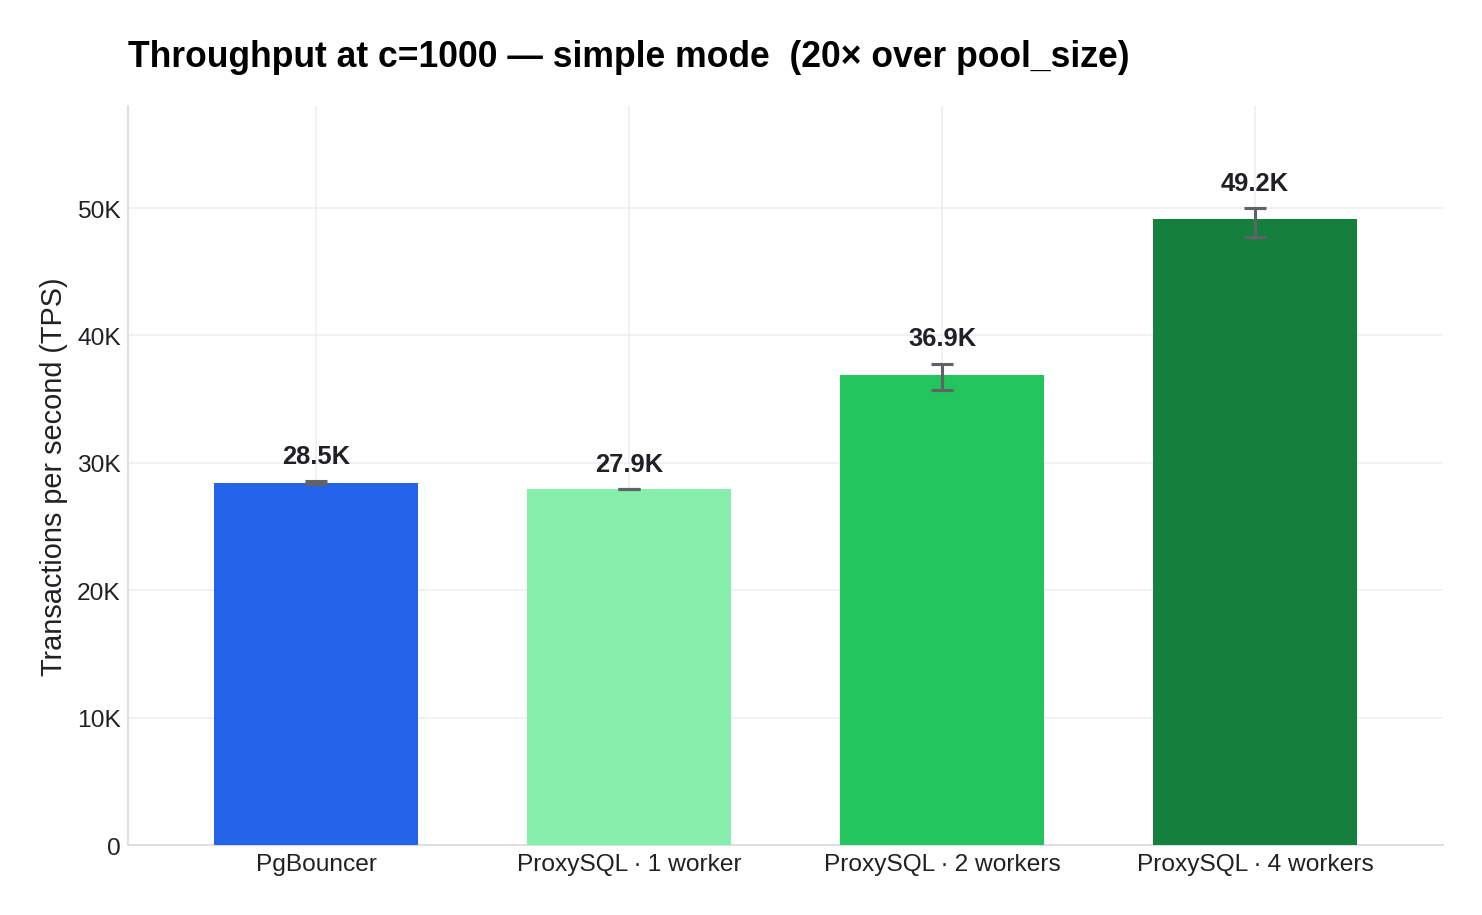
- PgBouncer: 28.5 K TPS — its single-thread dispatcher is now spending the bulk of its cycles on queue management; the cap is internal to PgBouncer, not the workload or the backend.
- ProxySQL · 1 worker: 27.9 K TPS — within 2 % of PgBouncer at the same CPU budget, even at 20× oversubscription. One ProxySQL worker holds the line against one PgBouncer process under heavy load.
- ProxySQL · 2 workers: 36.9 K TPS — 30 % more throughput than PgBouncer at this load.
- ProxySQL · 4 workers: 49.2 K TPS — 75 % more throughput than PgBouncer at this load.
This is what pgsql-threads buys at heavy load: a single ProxySQL instance scales with the cores it’s given, while PgBouncer’s single-thread design cannot.
Bottom line for simple mode
ProxySQL matches PgBouncer’s throughput at the same CPU and scales beyond it when given more workers.
- Single-thread parity. ProxySQL · 1 worker delivers within 2–6 % of PgBouncer at every concurrency point, while doing the per-query work Part 2 covered (which PgBouncer doesn’t).
- Multi-thread headroom. Adding workers inside one ProxySQL instance scales beyond PgBouncer’s single-process ceiling — 1.4× at two workers, 2.3× at four.
At equal CPU, ProxySQL gives you everything PgBouncer does plus the per-query feature set from Part 2 — and the option to scale further inside one instance.
What’s next
Coming up in Part 4: the same benchmark for pgbench --protocol=extended and --protocol=prepared — closer to how application servers actually talk to PostgreSQL.