HTAP on MariaDB with ProxySQL, measured again
Our post on running heavy reports next to a MariaDB application through ProxySQL got three good questions from the MariaDB side:
- Sending reads through DBTrail adds a hop: how much does it cost each query?
- The router decides from the query, so how does it avoid sending the wrong queries to the copy?
- Why compare against MariaDB Exa and not against an open-source setup: an async replica that streams InnoDB into tables of MariaDB’s new DuckDB storage engine?
We reran the whole benchmark to answer all three with numbers. Same source (MariaDB 10.11), same ProxySQL (3.1.12), same load, same reports, plus a separate measurement of the hop and the replica setup we had left out.
The short version
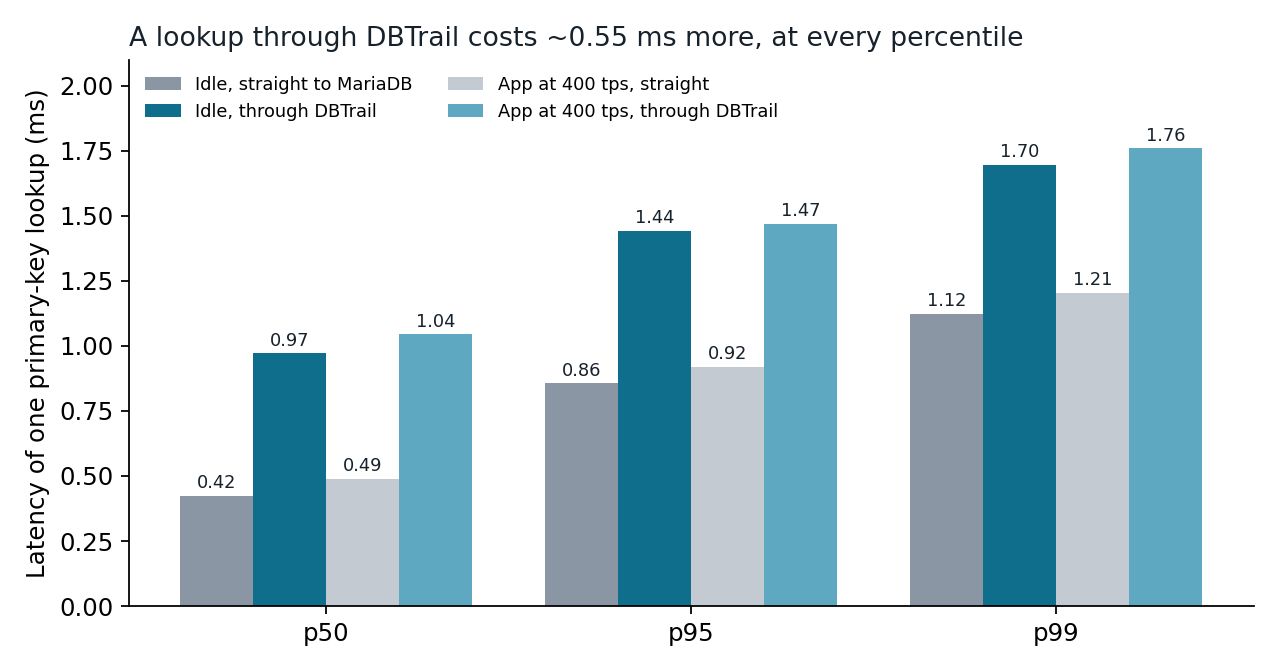
- The hop costs about 0.55 ms per query, at the median, p95 and p99, with or without load. About 0.1 ms of it is MariaDB building the plan (EXPLAIN); the rest is network round trips and DBTrail.
- The original result holds. With the reports on MariaDB the application’s p95 was 16.8 s and 8 reports finished during the run. With the reports sent to DBTrail, the application’s p95 was 12 ms and 289 reports finished.
- No wrong routing in the run. All 240,000 primary-key lookups went to MariaDB and every report went to the copy.
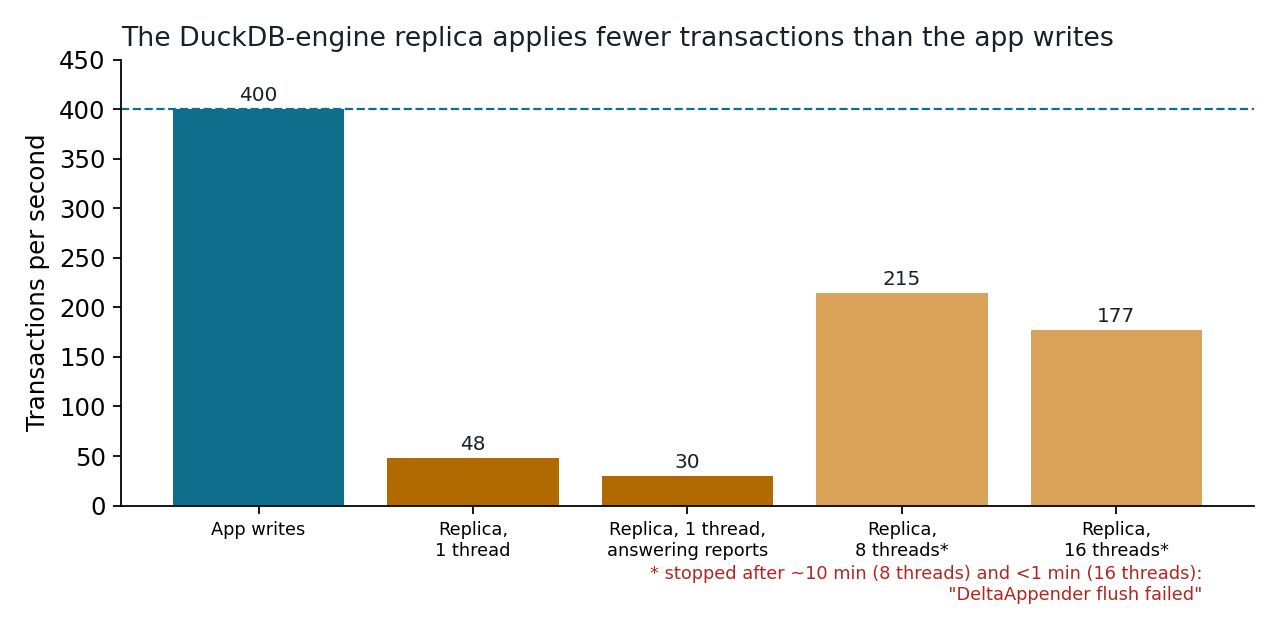
- The DuckDB-engine replica does not keep up yet. With the published package, replication stops at the first replicated UPDATE. With the fix that was still in testing when we ran the benchmark, it applies 30 to 48 transactions per second against the 400 the application writes, and parallel replication stops with an engine error after a few minutes. Its queries are fast (0.1 to 0.3 s), but on data it falls further behind every second.
Setup
| Role | Instance | Software |
|---|---|---|
| Source | m7g.2xlarge (8 vCPU, 32 GB), 200 GB gp3 | MariaDB 10.11.14 (Ubuntu 24.04 package), buffer pool 6 GB, binlog ROW / FULL, utf8mb4, performance_schema on |
| DBTrail | m7g.2xlarge, 200 GB gp3 | DBTrail 0.128.1 for the benchmark, 0.133.0 for the hop (Docker Compose), fresh mode on, Engine Routing on |
| DuckDB-engine replica | m7g.2xlarge, 200 GB gp3 | MariaDB 11.4.13 + mariadb-plugin-duckdb (published), then the 11.4 branch built from source (commit 095cfb5e468e, DuckDB 1.5.5) |
| Client | m7g.xlarge | ProxySQL 3.1.12, sysbench 1.0.20 |
The hop was measured on 0.133.0 because on 0.128.1 the same lookups fail with error 1273 (Unknown collation: 'utf8mb4_0900_ai_ci'): before 0.133.0, DBTrail’s port forwarded every statement under a MySQL 8 collation that MariaDB 10.11 does not have. The benchmark itself ran on 0.128.1 because 0.133.0 has two problems with this setup: its copy does not answer a utf8mb3 connection, which is what the stock MariaDB client and a client behind ProxySQL that names no character set get (dbtrail/dbtrail#2917), and it does not answer AVG(LENGTH(col)) under the MariaDB client’s default collation (dbtrail/dbtrail#2918).
Data: sysbench, 8 tables of 10 million rows (80 million rows). Application load: sysbench oltp_read_write through ProxySQL, 16 threads with a target rate of 400 transactions per second. Reports: the same three as in the original post, run in two loops for the whole run.
-- R1
SELECT k % 100 AS bucket, COUNT(*), AVG(LENGTH(c)) FROM sbtest1 GROUP BY bucket ORDER BY bucket;
-- R2
SELECT k % 1000 AS b, COUNT(*), SUM(id) FROM sbtest2 WHERE id BETWEEN 1 AND 8000000 GROUP BY b ORDER BY b;
-- R3
SELECT id, k FROM sbtest3 ORDER BY k LIMIT 20 OFFSET 5000000;
1. The extra hop
We sent the same primary-key lookups (sysbench oltp_point_select, autocommit, no prepared statements) straight to MariaDB and through DBTrail, at a fixed 1,000 per second for two minutes, first idle and then with the application running at 400 transactions per second.
| Path | p50 | p95 | p99 |
|---|---|---|---|
| Idle, straight to MariaDB | 0.42 ms | 0.86 ms | 1.12 ms |
| Idle, through DBTrail | 0.97 ms | 1.44 ms | 1.70 ms |
| App at 400 tps, straight | 0.49 ms | 0.92 ms | 1.21 ms |
| App at 400 tps, through DBTrail | 1.04 ms | 1.47 ms | 1.76 ms |
Where the 0.55 ms goes:
- Before it decides, DBTrail asks MariaDB for the plan with
EXPLAIN FORMAT=JSON. MariaDB’s own statistics (performance_schema) put that at 0.09 to 0.11 ms per statement. - A network round trip between the DBTrail and MariaDB machines took 0.14 ms (ping, same subnet). The path through DBTrail adds two or three of them.
- The rest is DBTrail’s own work.
The application did not notice: with the lookups going through DBTrail, its p95 was 11.87 ms, against 11.65 ms with everything straight to MariaDB. And the hop only applies to the queries you send to DBTrail. ProxySQL chooses by query pattern, and in these runs the application’s reads inside transactions never left MariaDB.
On routing mistakes: DBTrail does not decide from the shape of the query. It reads MariaDB’s own plan, with the optimizer’s row estimates. In this run, all 240,000 lookups were forwarded to MariaDB and all the reports were answered by the copy. When the router sends a query to MariaDB that the copy could have answered, the cost is speed, not a wrong answer: the copy is designed to reject queries with known compatibility differences. The result-formatting difference we observed is noted below.
2. The original benchmark
Same protocol as the original post: 180 seconds of warm-up with the application alone, then 300 measured seconds, with a pause between runs so one run’s reports do not leave MariaDB’s buffer pool cold for the next.
| Run (300 s, target of 400 TPS) | App p95 | Reports finished | R1 / R2 / R3 average |
|---|---|---|---|
| Reports on MariaDB | 16,819 ms | 8 | 72 / 79 / 148 s |
| Every SELECT to DBTrail (the original post’s rules) | 12.08 ms | 289 | 5.4 / 0.3 / 0.5 s |
| Only the three reports to DBTrail | 11.24 ms | 272 | 5.5 / 0.5 / 0.6 s |
| Only the three reports to DBTrail, 25 minutes later | 11.45 ms | 281 | 5.5 / 0.3 / 0.6 s |
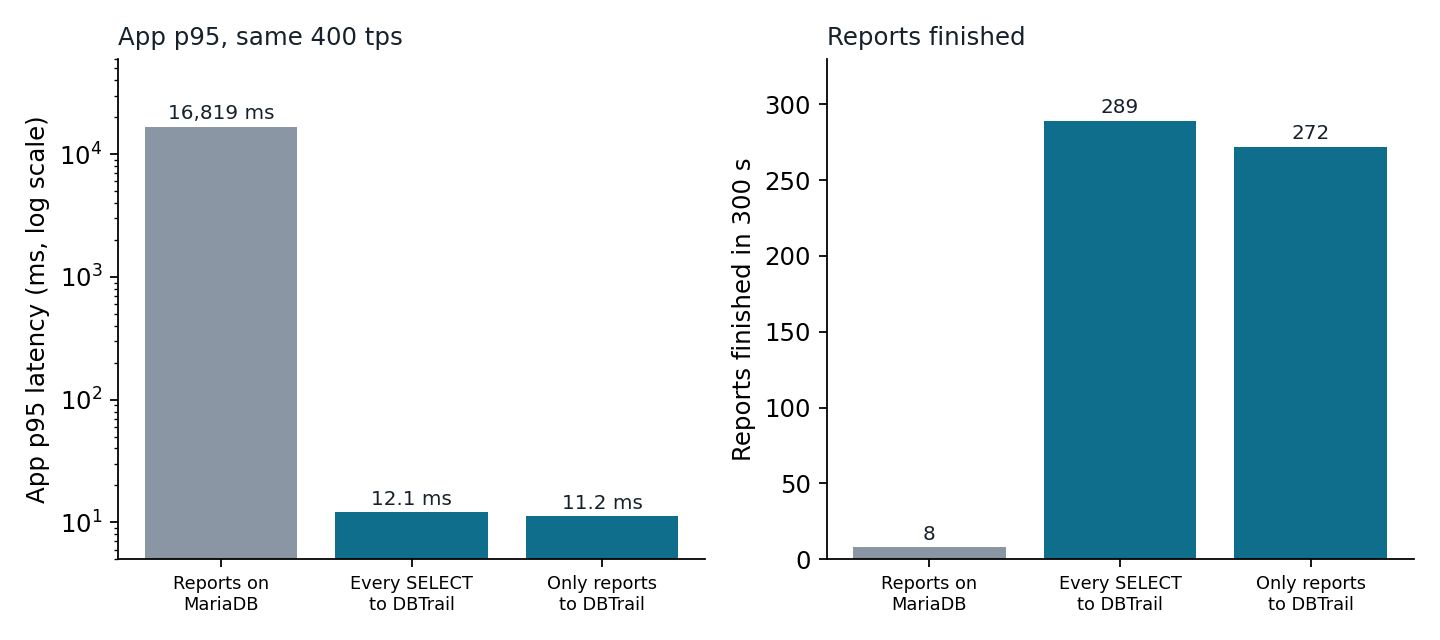
The 300 seconds refer to application load. The linked reproduction script waits for reports already in flight to finish and logs those completions too. The supplied totals therefore should not be read as strict 300-second report throughput without filtering by completion time. The 400 TPS setting is a target rate, rather than a measurement of achieved throughput.
With the application alone, its p95 was 11 to 13 ms. The original post measured 13.7 ms alone, 6,960 ms with the reports on MariaDB and 13.2 ms with them on DBTrail, with 12 against 266 reports.
We checked the reports’ results with the application stopped. R2 was byte-identical on both sides. R3 returned the same rows, ordered differently among ties (many rows share the same k). R1 returned the same values with different formatting: MariaDB prints the average as 119.0000 and DBTrail as 119 (dbtrail/dbtrail#2920).
3. The async replica with DuckDB-engine tables
MariaDB’s DuckDB storage engine ships as a plugin for 11.4, 11.8, 12.3 and 13 (mariadb-plugin-duckdb). We set up a MariaDB 11.4 replica of the 10.11 source with the sbtest tables created as ENGINE=DuckDB, loaded them from a mariadb-dump, and started replication from the dump’s position. The replica got only the three reports, matched by pattern in ProxySQL: the engine creates no indexes, so the application’s lookups would have to scan the table.
Two practical notes for anyone trying this: the engine does not accept AUTO_INCREMENT, which sysbench tables use, so the DuckDB tables are created without it and loaded separately; and the engine takes only UTF-8 text.
With the published package (11.4.13), the initial load of 80 million rows worked (10 minutes of dump plus 11 of load), and replication stopped at the first replicated UPDATE:
Could not execute Update_rows_v1 event on table sbtest.sbtest1; Storage engine DUCKDB of the table
`sbtest`.`sbtest1` doesn't have this option, Error_code: 1031
At the time of testing, support for applying replicated changes to DuckDB tables was in the MariaDB 11.4 branch (MDEV-40957), marked In Testing and not yet released. So we built the 11.4 branch from source and repeated the test on the same instance type.
| Replica (11.4 branch, read-free apply) | Transactions applied per second | Note |
|---|---|---|
| 1 applier thread | 48 | stable |
| 1 thread, while answering the reports | 29 to 30 | stable |
| 8 threads, optimistic parallel | 213 to 216 | stopped after about 10 minutes |
| 16 threads | 177 | stopped within a minute |
| The application writes | 400 |
Both parallel runs stopped with the same error, and every worker aborted after it:
Got error 168 'DeltaAppender flush failed' from DuckDB, Internal MariaDB error code: 1296
Commit failed due to failure of an earlier commit on which this one depends, Error_code: 1964
Relaxing durability did not change the rate: with one thread, innodb_flush_log_at_trx_commit set to 1, 2 and 0 gave 47, 45 and 49 transactions per second. Changing this InnoDB setting did not improve the DuckDB applier rate in these runs.
With the applier running, the reports through ProxySQL were fast: R1 0.2 s, R2 0.1 s and R3 0.3 s on average, over 1,030 of each in 5 minutes, and the application’s p95 stayed at 12.5 ms. The catch is the data under them. At 30 to 48 transactions applied per second against 400 written, the replica falls further behind for as long as the application runs at this load, and the reports answer from that older state.
One more behavior to know: read-free apply does not check that a row exists. Twice, after a failed initial load on our side, the replica started from empty tables and applied UPDATE and DELETE events for rows it did not have, with no error. A replica that diverges keeps answering as if it were in sync.
Both are reported to MariaDB: MDEV-42299 (parallel replication stops with the DeltaAppender error) and MDEV-42300 (replicated changes applied to rows the replica does not have, with no error).
What we did not measure
- DBTrail’s freshness under this load. The original post measured 0.9 to 3.0 seconds behind the source in fresh mode (2026-11-07); this run did not repeat it.
- The DuckDB-engine replica on a larger instance, or with a lighter write load, where it could keep up.
- Larger data sets, other report shapes, or an end-to-end application/report benchmark longer than these five-minute load windows.
How to reproduce it
Everything runs on four Ubuntu 24.04 arm64 instances in one subnet, with a security group that allows all traffic between them and nothing from outside. The full procedure, with every command, configuration file and script we used, is in the DBTrail repository: Benchmark: HTAP on MariaDB with ProxySQL, and a DuckDB-engine replica.
It is split in the same steps as the runs:
- Machines
- Source: MariaDB 10.11 and the data
- DBTrail
- ProxySQL on the client machine
- The DuckDB-engine replica (published package, or the 11.4 branch built from source)
- The scripts
- The runs
- Clean up